

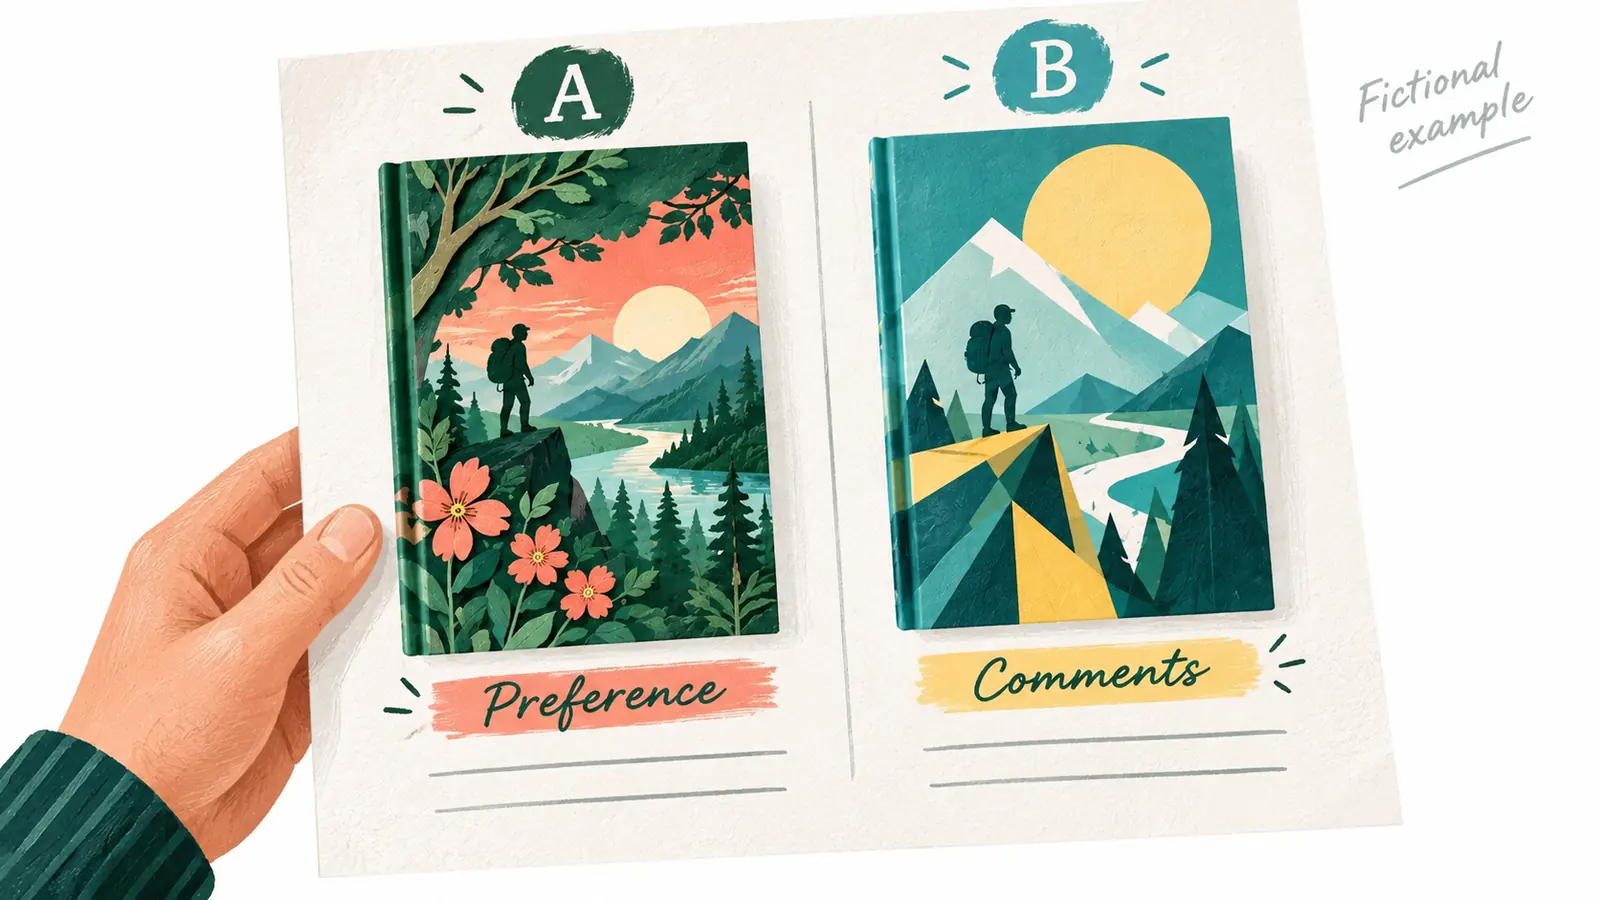
Start with the decision, not the winner badge
A cover poll can show which option participating readers preferred under the conditions you supplied. It cannot establish how everyone shopping on Amazon will behave. Before launching, write one decision: “Which cover more clearly signals a cozy mystery to the readers we reached?” That is narrower and more useful than “Which cover will sell best?”
Use the same title, author name and presentation size if you want to investigate the artwork. If both title and artwork change, call it a package comparison. Keep a copy of each version, the exact question, language, recruitment context and field dates. Without those records, a later change in preference is difficult to interpret.
Virtalibry supports several poll types, including cover, title, description and mixed comparisons. The participant workflow records a selected winner as well as option ratings and written comments. These are different measurements; a five-star option rating inside a poll is not an Amazon customer rating.
Count completed responses for the question you are reporting
Check the poll ID and completion state before interpreting the results. An invitation, a claimed task and a completed response are not the same event. For a single-winner share, divide an option's completed winner selections by completed responses with a valid winner. Explain exclusions rather than silently changing the denominator.
Keep raw counts beside percentages. “Cover A received 24 of 40 valid winner selections” makes the sample visible; “60% of readers want this book” changes both the population and the question. The latter claim is not supported by a preference poll.
Do not manufacture missing data. If you have only the aggregate total, you cannot reconstruct individual reasoning or infer which participants would buy. If an export has incomplete rows, retain the original and document the cleanup rule before recalculating.
A smaller poll can show a larger-looking percentage
| Poll | A selections | B selections | Valid responses | A share |
|---|---|---|---|---|
| Group 1 | 24 | 16 | 40 | 24 / 40 = 60% |
| Group 2 | 3 | 5 | 8 | 3 / 8 = 37.5% |
Group 2 favors B by 62.5%, but that is five selections, not evidence that B converts 62.5% of shoppers. One participant switching from B to A would make that group a 4–4 tie. In Group 1, one such switch changes A's share by 2.5 percentage points. Show this sensitivity before treating a small lead as decisive.
Pooling the counts would produce 27 A selections out of 48, or 56.25%. That arithmetic is correct, but pooling may answer the wrong question when the groups differ in genre interest, language or recruitment. A bigger combined number does not repair an audience mismatch.
Audience fit matters more than a confident label
Ask who participated and how they arrived. A voluntary platform sample is not automatically a random sample of your intended buyers. A large sample can still favor a visual style that attracts the wrong genre audience. Record what you know about fit and leave unknown characteristics unknown.
AAPOR's survey guidance emphasizes clear questions, appropriate sampling and transparent methods. This article applies those general principles to an informal cover comparison; it does not turn the platform poll into a representative survey or supply a universal minimum sample size.
Separate ratings, preferences and reasons
A participant may rate both covers highly but still select one. Report winner counts separately from option scores. Do not combine the two into an unexplained “conversion score”. If you calculate an average rating, state the scale, valid count and aggregation method; it remains an assessment of these options, not a purchase probability.
Read comments for a specific repair: an unreadable subtitle, an unexpected tone, a confusing focal point or a mismatch with the description. Preserve criticism. A favorable sentence is not more informative merely because it agrees with your preferred design.
| Comment pattern | Check | Do not infer |
|---|---|---|
| Subtitle is hard to read | Inspect the actual thumbnail and contrast. | That a larger subtitle guarantees more purchases. |
| Looks like a thriller, not a cozy mystery | Compare imagery and tone with the manuscript promise. | That every mystery reader rejects the design. |
| I prefer the colors | Record the preference; ask whether genre communication also works. | That color preference measures willingness to pay. |
Make one justified change and preserve the comparison
Choose a concrete edit supported by repeated observations. Keep the earlier version and note what changed. If you run another poll, preserve the question and relevant conditions where possible; a new cover, new question and different audience cannot isolate the effect of one edit.
For a close result, choose the option that best fits the book and is readable at the required size, or gather more relevant feedback within a defined time allowance. Repeating polls until your favorite wins is not validation. Stop when the remaining question needs a different method, such as reading the sample or checking the live listing.
Write the conclusion you can actually defend
“In this fictional 40-response comparison, A received 24 winner selections. Several comments identified subtitle readability. We will revise that element while retaining the genre cues, then inspect the new thumbnail.”
That conclusion preserves the sample, observation and next action. It does not claim that sales improved or that Amazon will rank the book higher. For the wider process, read the marketing checklist; for the words paired with the cover, use the AI description audit.
Return to the blog for the editorial collection or How It Works for the actual poll workflow. Source checked on 15 October 2026; all numerical examples here are fictional.